
If you’ve been looking for cotton planting, price, and supply numbers, you’ve come to the right place. This is our 3rd Quarter Cotton Report, where we cull stats for our more analytical readers that want to know what’s happening with cotton at home and abroad. These will focus on planting and ginning updates, current cotton price comparisons, and supply and consumption numbers. Please note that changes from our last quarterly report are indicated with bold type.
Overview: Cotton Prices Reflect Global Supply/Demand
US December 2014 Cotton Futures closed at $.6812/lb. based on the ICE Futures US Exchange. This is down 24% from the May 2014 peak of $.9475/lb. This is the lowest price for cotton in 20 months.
So what has driven the price of cotton down in just 2 months? As the July Futures price rolled off the board in late June, essentially ending the 2013 crop which had already been largely committed for and bought, focus was then put on the 2014 crop and the December Futures price.
Final reports have the US planting more cotton acreage in 2014 for the first time in three years. Approximately 11.4 M acres were planted in 2014, which is 9.3% more than was planted in 2013. This increase in cotton acreage is due in large part to the high price for cotton this spring as opposed to alternative crops such as corn, whose price had dropped in the spring of 2014.
China continues to sit on huge inventories of cotton, which should decrease demand for exported cotton. World-ending stocks have been adjusted once again by the USDA and increased by another 1.6 M bales due to cuts in China and Pakistan cotton consumption. China continues to sit on 50% of the forecasted world-ending stocks.
In 2013, Texas had suffered through a terrible drought and the crop was greatly affected with large areas of abandoned crop. Recent rains in Texas have been timely and the 2014 crop is doing well. With an additional 11.2% more acres planted in Texas and the recent rainfall, expectations are high for the largest cotton growing state.
US Crop Planting/Ginning Update
2013 Plantings in the U.S.: 10.3 million acres (down 16.8% from 2012)
2014 Projected Plantings in the U.S.: 11.3 million acres (up 8.2% from 2013)
The number of acres planted in the U.S. has ranged from 9.15 million acres to 15.27 million acres over the past nine years. Here are regional projections:
• Acreage in the Southeast U.S. is projected to be up 3.6% (previously down 1.2%)
• Acreage in the Mid-South U.S. is projected to be up 18.2% (previously up 12.5%)
• Acreage in the Southwest U.S., which includes Texas, is projected up by 12.2%
• Western U.S. acreage will be down by 19.5% (previously down 5.8%), with California down by 30.1% (previously down 27%).
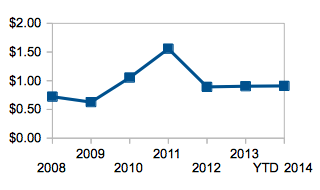
Cotton Pricing Update
A Index (proxy for the world price of cotton)—average of the day’s five cheapest Far Eastern quotations.
| 2008 | $.7221 |
| 2009 | $.6275 |
| 2010 | $1.054 |
| 2011 | $1.557 |
| 2012 | $.8924 |
| 2013 | $.9042 |
| YTD 2014 | $.9329 (previously $.9096) |
| Oct 2014 | $.6845 |
| Dec 2014 | $.6765 |
| Mar 2015 | $.6823 |
| May 2015 | $.6948 |
| July 2015 | $.7061 |
Supply/Consumption & Export Update
U.S. Outlook
- U.S. production is forecasted to be 16.5 (previously 16.4)million bales for the 2014 crop as compared to 13.2 million bales in 2013.
- U.S. Consumption of cotton in 2014 is forecasted at 3.8 (previously 3.7) million bales as compared to a low of 3.3 million bales in 2011.
- Exports of U.S. grown cotton is forecasted to be 10.2 (previously 9.98) million bales which is a 5% decrease from the 10.5 million bales from the 2013 crop.
Global Outlook
- Cotton production outside of China is forecasted to be 86.6 (previously 87.9) million bales in 2014 as compared to 84.8 million bales in 2013.
- Global consumption of cotton outside of China is forecasted to be 74.8 (previously 76.4) million bales in 2014, which compares to 74.0 million bales in 2006.
China Outlook
- China production is forecasted to be 29.5 (previously 30.1) million bales in 2014 which is down by 9.1% from 2013 and 16% less than in 2012.
- Since the unprecedented run-up in cotton prices in 2011, China has increased their inventory levels year over year for a three-year total of 47.8 million bales added to existing inventory, for a total of 58.3 million bales.
- China consumption is forecasted to increase slightly to 36.5 (previously 36.4) million bales, or about a 5.8% increase. At current consumption rates, China has 20 (previously 19) months of cotton inventory.
- China’s import of cotton peaked in 2011 with 24.5 million bales being imported, 11.0 million bales imported in 2013, and 8 (previously 6.4) million bales being forecasted for 2014.